After we predict the relationship between the variables, it is always important to evaluate how well it fits the data. For this, we use new measure called R- squared
Strength of the fit of a linear model is most commonly evaluated using R-Squared
This is simply calculated by square of correlation coefficient. R-squared also tells us what percent of variability in the response variable (Y) is explained by the model. The reminder of the variability is explained by variables not included in the model.
The value of R-squared is always between 0 and 1
R-squared tells the goodness of the fit.In addition, it does not indicate the correctness of the regression model. The user should always draw conclusions about the model by analyzing r-squared together with other variables in a statistical model.
The most common interpretation of r-squared is how well the regression model explains observed data. For example, an r-squared of 60% reveals that 60% of the variability observed in the target variable is explained by the regression model. Generally, a higher r-squared indicates more variability is explained by the model.
However, it is not always the case that a high r-squared is good for the regression model. The quality of the statistical measure depends on many factors, such as the nature of the variables employed in the model, the units of measure of the variables, and the applied data transformation. Thus, sometimes, a high r-squared can indicate the problems with the regression model.
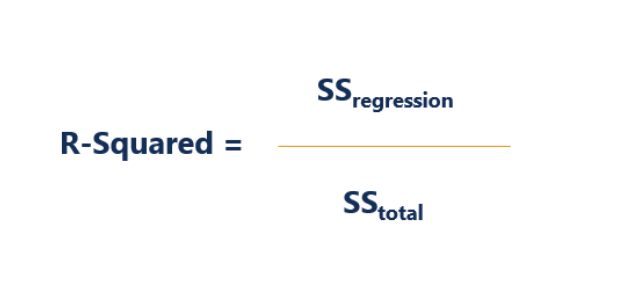
The formula to calculate R-squared is

Where:
- SS regression is the sum of squares due to regression (explained sum of squares)
- SS total is the total sum of squares
Consider the example of following plot

The points are close to the regression line and so the R-squared value will be high and near to 1.
R-squared is also known as Coefficient of determination
I have also found other formula for R-squared with respect to residual
The sum of squares of residuals

The total sum of squares would be

So the definition would be

where the mean of the response variable is

In some cases, the simple linear regression, the total sum of squares equals the sum of the two other sum of squares

