What is the best fit line?
The line that gives very less error/residuals(difference between predicted to actual value) be it over estimation or under estimation.
Best fit line would be the line which has the minimum error.
Overestimation and underestimation gives positive and negative errors.
How do we calculate the minimum error for the best fit line if it has both positive and negative values?
- Calculate absolute value of residuals: taking the absolute values of the residuals and sum it to get the error that the line would have as a whole considering all the data points.
- Calculate the squares of residuals: We can also use square of the errors and then sum them so that it doesn’t matter if the value is negative or positive. — This is called Least Squares
Why did we choose Least Squares to determine the best fit line?
- It is most commonly used
- Easier to compute by hand and using any software
- In many applications, a residual is twice as large if it is doubled can be twice as bad

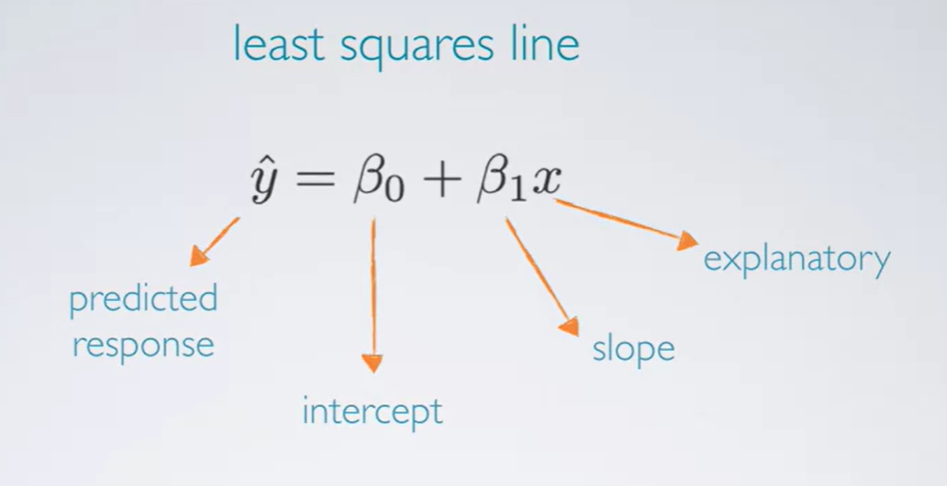
The above diagram shows the least square line equation where x is the explanatory variable and y^ is the predicted response.
As this is the best fit line which has the least sum of squares of residuals, let us use some formulas to estimate the slope and intercept
Estimate slope:
slope is the standard deviation of Y divided by the standard deviation of X multiplied by correlation coefficient R

Estimate Intercepts:
Intercept is the point where the regression line crosses the y-axis. For this, we would be using the property that the least squares fit line always passes through the point which is mean of X and mean of Y. so by rearranging and then substituting the mean of X and mean of Y, the formula for intercepts would be as follows:

Summary-
Intercept — When x=0, y is expected to equal to the intercept. Sometimes this may be meaningless in context of the data, and only serve to adjust the height of the line
Slope — For each unit increase in X, Y is expected to be higher/lower on average by the slope.
